blog
A Mac with 65% RAM free nearly panicked: the compressor, IOSurface and Playwright's WebKit
A 32 GB Mac Studio panicked with 100% of compressed pages limit, then came close to a second panic that evening while RAM still showed 65% free. The page count in the compressor had filled up, and the culprit was IOSurface that Playwright WebKit left in the kernel.
- Published
- Updated on
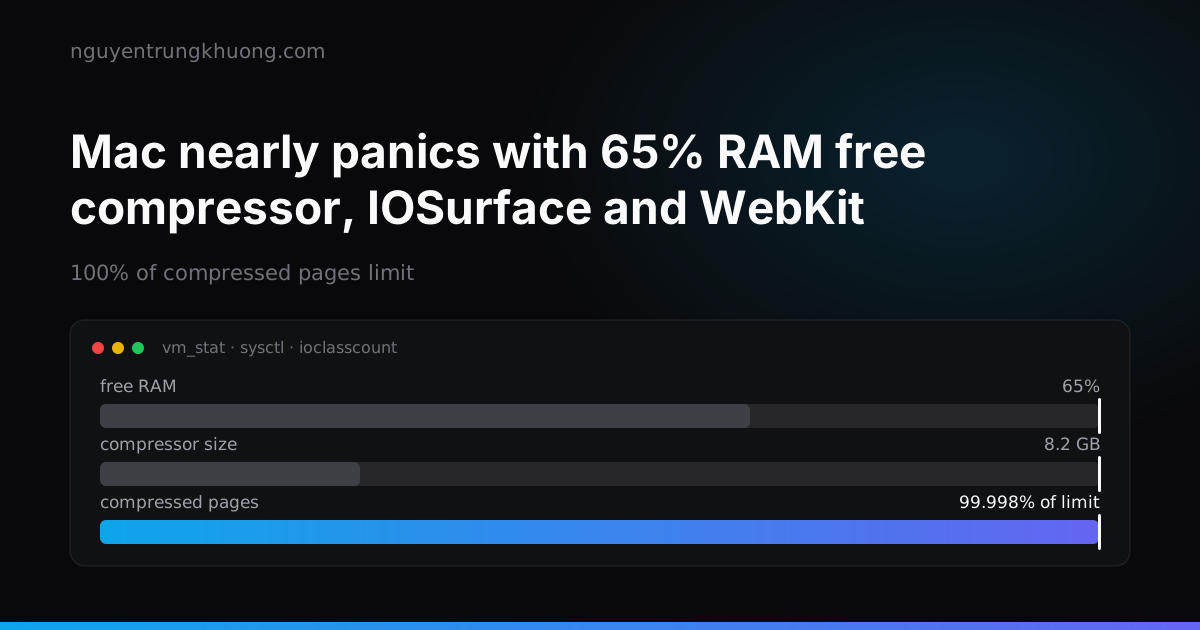
On 31 Oct 2026 my Mac panicked at 13:55 and nearly panicked again at 21:12, while RAM still showed 65% free. Both times, the number of pages in the macOS compressor had hit its limit. The usual RAM metrics cannot see this limit, and the culprit in the end was Playwright's WebKit, not headless Chrome as I first suspected.
This was the second panic of the month, with a different panic string. The first one was the kernel zone data.kalloc.1024, written up in the post kernel panic data.kalloc.1024 when running many Claude Code sessions.
The machine and the e2e suite: three of four projects ran WebKit
Mac Studio M1 Max, 32 GB RAM, macOS 26.7.1. Many Claude Code sessions run in parallel in tmux, one per project, driven remotely through Remote Control. The machine runs all the time with nobody sitting at it.
The sessions use the Playwright and Chrome DevTools MCP servers (headless Chrome), and run e2e tests with Playwright. The e2e suite has 4 projects: desktop runs Chromium; mobile, tablet and tablet-landscape use Apple device descriptors, which means they run WebKit.
12:06 to 13:55: real RAM shortage, then a watchdog panic
The 32 GB machine was carrying about 45 to 50 GB: about 40 Claude Code processes (14.8 GB), Chrome plus the headless Chrome of the MCP servers (about 8.5 GB), the IDE (5.8 GB), the Claude desktop app, node. The last straw was three temporary sessions with browser MCP servers, opened between 11:37 and 12:05.
At 12:06 the first JetsamEvent appeared: compressor at 16.3 GB, free RAM 0.26 GB, and macOS killing daemons in bulk to reclaim RAM. The machine lived with the shortage for almost 2 hours, then panicked at 13:55:
watchdog timeout: no checkins from watchdogd in 92 seconds
Compressor Info: 100% of compressed pages limit (BAD) and 31% of segments limit (OK)
The kernel_task figure of 149 to 159 GB in the JetsamEvent and the panic log does not reflect real RAM. Do not rely on it.
Reading JetsamEvent and the panic log to see who holds the RAM
ls /Library/Logs/DiagnosticReports/{,Retired/}
Take the JetsamEvent-*.ips and panic-full-*.panic files. In the panic log, memoryStatus.compressorSize (in 16 KiB pages) tells you how big the compressor is, and processByPid[].residentMemoryBytes summed by procname tells you which group of processes holds the RAM.
First fix: a ram-gate hook that blocks heavy commands when RAM is low
At this point I treated it as a RAM shortage:
- Closed apps I did not need and kept only the essentials.
- Sessions with little use (16 messages or fewer in 7 days) became open-on-demand. Temporary sessions get closed when their work is done.
- The scheduled watchdog script now also logs compressor size, pressure level (
kern.memorystatus_vm_pressure_level) and free RAM percentage. It alerts at two levels: a warning when the compressor reaches 10 GB, and a critical alert when it reaches 13 GB or pressure hits level 4. Each alert lists the 5 largest process groups.
I added a Claude Code PreToolUse hook named ram-gate. The hook does not forbid running things in parallel; it only blocks when RAM is low. It catches heavy commands: npx playwright, playwright test, make|npm run … e2e, the e2e.sh script, vite build, next build, Chrome --headless, lighthouse <url>, and every tool of the Playwright and Chrome DevTools MCP servers except the one that closes a page.
The hook denies when any of these is true:
- free RAM under 30% (
kern.memorystatus_level); - compressor at 8 GB or more and free RAM under 50%;
- compressor at 12 GB or more, whatever the free RAM;
- memory pressure at 2 or higher.
The deny message tells the session to wait a few minutes and run again, and not to look for a way around it. Each deny writes one log line. The hook matches commands, not words: cat e2e/x.spec.ts or grep playwright still pass. On an unexpected error the hook fails open, meaning it lets the command run.
Two traps when tuning the hook thresholds
- The compressor holds old pages long after RAM is free again. That afternoon the compressor sat at 8.5 GB while 65% of RAM was free. The first version of the hook looked only at the compressor reaching 8 GB, so it wrongly blocked e2e for about 30 minutes. That is why the 8 GB threshold gained the "free RAM under 50%" condition.
- Wrapper scripts slip through. The e2e suite is called through
./scripts/e2e.sh, which the hook's first patterns did not recognise, so the heavy command got through. I had to add a pattern for the wrapper script.
21:12: close to a second panic while RAM still showed 65% free
That evening only about 6 sessions were left: one running e2e, one writing Go, the rest idle. Every metric the hook and the watchdog script relied on looked fine: 65% of RAM free, the compressor at only 8.2 GB, low pressure.
The compressor had hit its page count limit. The "Pages stored in compressor" line of vm_stat read 13,192,238, against a sysctl vm.compressor.pages_compressed_limit of 13,192,448, which is 99.998%. The "Pages occupied by compressor" line was only about 537,000 (8.2 GB).
The compression ratio was about 25:1, meaning the pages were almost all zeros: about 200 GB of data took only 8 GB of RAM. The machine had no swapfile at all (vm.swapusage total 0).
The owner of those pages was kernel_task: 208 GB in top -l 1 -pid 0 -stats mem. All user processes together compressed only about 4.3 GB.
ioclasscount reported IOSurface 34,851, IOSurfaceClient 34,878, AGXResource 71,435, where a normal machine has a few hundred IOSurface. 200 GB divided by 34,851 gives about 5.9 MB per surface, close to one 1440×900 browser frame.
The count stayed flat while the machine was idle, and did not drop even with no browser running: the GPU buffers stay behind in the kernel. footprint of the user processes saw only a few hundred surfaces.
The 13:55 panic had logged the same line, 100% of compressed pages limit. Free RAM, compressor size and memory pressure, the three metrics the hook relied on, cannot see this kind of exhaustion.
A controlled test after a reboot: WebKit left 2,251 IOSurface behind
A reboot is the only way to get kernel memory back. I rebooted at 21:49 and measured from scratch: right after boot there were 194 IOSurface, kernel_task at 656 KB, compressed pages at 0%. The measuring loop, every 30 seconds while e2e ran:
while sleep 30; do
  echo "$(date +%T) surf=$(ioclasscount IOSurface | awk -F'= ' '{print $2}') \
agx=$(ioclasscount AGXResource | awk -F'= ' '{print $2}') \
stored=$(vm_stat | awk -F: '/stored in compressor/ {gsub(/[ .]/,"",$2); print $2}')"
done
Run 1, full suite (21:51:49 to 22:00:34, 444 tests passed):
| Time | Project running | IOSurface | AGXResource | Compressed pages |
|---|---|---|---|---|
| 21:51 | start, Chromium | 163 | 1,708 | 0 |
| 21:53–21:54 | Chromium | 109–110 | 1,751–2,001 | 0 |
| 21:55 | WebKit starts | 200 | 2,282 | 0 |
| 21:57 | WebKit | 1,035 | 3,954 | 0 |
| 21:59 | WebKit | 1,804 | 5,497 | 0 |
| 22:00 | done, WebKit has exited | 2,251 | 6,349 | about 82,000 |
While WebKit ran there were Playwright.app from the Playwright WebKit package and com.apple.WebKit.GPU.xpc. After they exited, IOSurface stayed at 2,251 and kernel_task rose to 13 GB.
Run 2, Chromium only (--project=desktop, 22:01:14 to 22:04:32, 215 passed, 46 skipped): IOSurface held at 2,251 to 2,252 for the whole run, AGXResource at 6,349 to 6,352. After the run no browser process was left behind.
Conclusions from the two runs
- The culprit is Playwright's WebKit on macOS 26: every e2e run with WebKit leaks about 2,000 IOSurface (about 6 MB each) into the kernel through the WebKit GPU process. About 15 runs reach the compressed page limit and the machine panics.
- Headless Chrome, the first suspect, is innocent. The
--disable-gpuflag is unrelated too, since it is a Chromium flag. - Nothing frees the memory except a reboot. Closing the browser after the tests is necessary but not enough.
The fix: Chromium with device emulation, and a watch on compressed pages
Drop WebKit from e2e runs on the machine
The mobile and tablet screens still get their layout checked, but with Chromium emulating the viewport, touch and user agent. Keep the project names, because the specs filter by name. Do not use Playwright's built-in iPhone and iPad descriptors, because they default to WebKit.
import { defineConfig, devices } from '@playwright/test';

export default defineConfig({
  projects: [
    { name: 'desktop', use: { ...devices['Desktop Chrome'] } },
    { name: 'mobile', use: { ...devices['Pixel 7'] } }, // Chromium
    {
      name: 'tablet',
      use: {
        browserName: 'chromium',
        viewport: { width: 820, height: 1180 },
        deviceScaleFactor: 2,
        isMobile: true,
        hasTouch: true,
      },
    },
  ],
});
To confirm WebKit is gone: pgrep -fl 'ms-playwright/webkit' must return nothing while e2e runs.
Watch the compressed page count, not only the size
The ram-gate hook now also blocks when compressed pages reach 70% of the limit. To check by hand:
stored=$(vm_stat | awk -F: '/stored in compressor/ {gsub(/[ .]/,"",$2); print $2}')
limit=$(sysctl -n vm.compressor.pages_compressed_limit)
echo "compressed pages: $((stored * 100 / limit))% of limit, IOSurface: $(ioclasscount IOSurface | awk -F'= ' '{print $2}')"
Per-command tracing, scheduled checks, fewer auto-started sessions
- Per-command tracing: a PreToolUse hook records the IOSurface count before each heavy command; a PostToolUse hook counts again and logs the difference along with the command. A command that keeps leaving a positive difference is the culprit.
- The watchdog script runs every 5 minutes (it used to be every 10), and logs the compressed page ratio, the IOSurface count and
kernel_taskmemory. It sends a warning at 60% and 80%, and at 85% it asks for a reboot. - A check before opening another session: a script checks RAM (same thresholds as the hook), the number of headless Chrome processes, IOSurface, and which sessions share a folder, then refuses to open a session when RAM is low. Temporary sessions use a config preset for the kind of work; only sessions doing UI work get a browser MCP.
- Fewer sessions at boot: only a few core sessions open when the machine starts, the rest open when needed.
Lessons: enforce rules with a hook, and let thresholds allow for compressor lag
- macOS limits the number of pages in the compressor. Pages full of zeros compress very well and take little RAM, but each still counts toward the limit, so free RAM does not mean you are safe.
- Read the panic string before drawing conclusions.
100% of compressed pages limitis a different failure fromzone map exhaustedin the post on data.kalloc.1024. - One controlled test right after a reboot, measuring every 30 seconds and separating each browser type, gave a clearer answer than hours of guessing. The obvious suspect was headless Chrome, and it was innocent.
- An instruction like "only run one Playwright at a time" gets in the way when the machine has spare RAM, and still fails to stop anything when it runs short. A hook that measures real RAM does both jobs.
- The compressor keeps old pages for a long time, so a threshold based only on compressor size will block things for no reason.
What I could not prove
The 13:55 panic was most likely two things added together: IOSurface leaked by the morning's e2e runs, plus a real RAM shortage from about 40 processes. I was not counting IOSurface at the time, so I cannot prove it. The WebKit conclusion also rests on only two runs on one machine.
Related posts
all posts →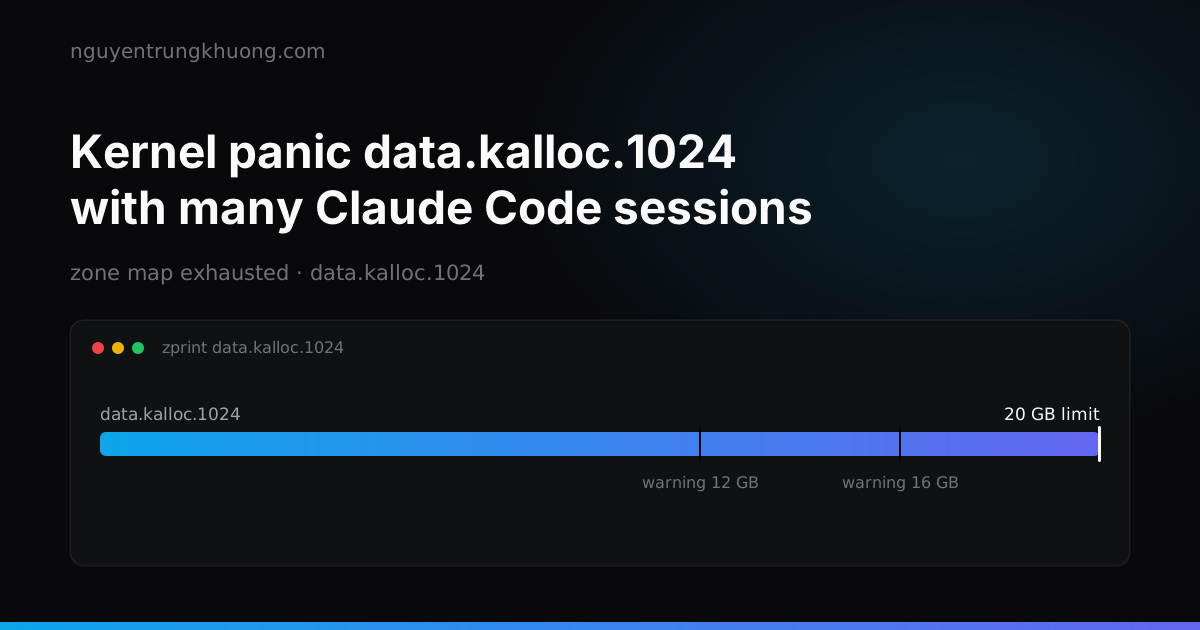 Kernel panic data.kalloc.1024 on a Mac running many Claude Code sessionsA 32 GB Mac Studio running about 20 Claude Code sessions rebooted itself five times because the kernel zone data.kalloc.1024 leaked to about 20 GB. How to watch it with zprint, why the npm install leaks faster, and the three steps that stopped it.read more →
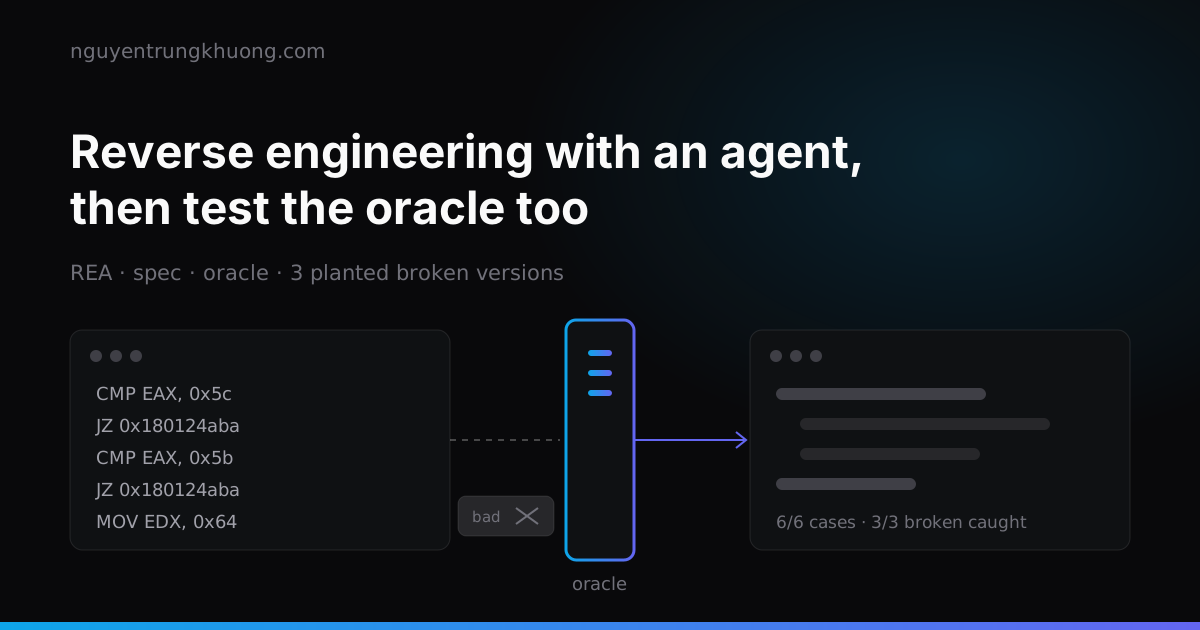 REA: letting an agent reverse engineer software, then testing the oracle tooREA lets a coding agent read a program that has no source, down to machine code, then rebuild that feature in its own code. Whether the rebuild is right is up to the oracle, and the oracle is code too, with its own bugs.read more →
 Top 10 Claude Code skills by GitHub stars: what each one does and which ones overlapThe ten Claude Code skill sets with the most GitHub stars on 29 Oct 2026: Superpowers, Matt Pocock Skills, Karpathy Skills, Anthropic Skills, Ponytail, UI UX Pro Max, Graphify, Caveman, Agent Skills, Taste Skill. Each one with its install command, what it does and where it overlaps with another set.read more →
 Claude Code + NotebookLM + Obsidian: a research pipeline, and the half of the bridge that is unofficialHow to combine Claude Code, NotebookLM and Obsidian into a research pipeline: which skills already exist, why NotebookLM has no API for personal accounts, and the price of wiring these three tools together.read more →